
Insights on Asian Options Markets
Asian options markets have split in several different directions over the past 15 years. Taiwan and India have exploded in growth, while Korea has actually shrunk in notional volume terms.
Volume Trends
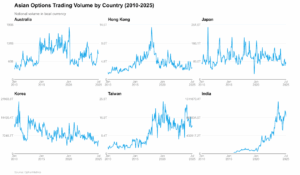
The chart above shows total notional volume of options trading over time from 2010-2025, using OptionMetrics data, for six major Asian markets: Australia, Hong Kong, Japan, Korea, Taiwan, and India. Each panel displays trading volume in local currency, so we can see how these markets have evolved and compare their different trajectories.
Taiwan and India are the standout performers, both markets have grown significantly, especially after 2020. Taiwan’s growth story appears to have nuance beneath the surface: while notional volumes have surged dramatically, available data suggests contract counts and market participation have increased at a much more modest pace. The pattern indicates growth may reflect higher underlying equity prices rather than increased activity, with indicators pointing to trader numbers and new account openings staying consistent throughout this apparent boom.
India’s explosive growth reflects a fundamental shift accelerated by COVID-19. The pandemic spurred millions stuck at home to open brokerage accounts, while weekly expiry contracts and mobile trading apps gamified the market. Derivatives traders jumped from under 500,000 to over 4 million, explaining the exponential volume curve. Jane Street’s entry into the Indian market also contributed as a factor driving market volumes higher.
Korea shows a different pattern. Volumes have dropped from their highs in the early 2010s, with a gradual decline in domestic trading, suggesting a long-term structural shift rather than a single event.
Established markets remain more stable. Japan, Australia, and Hong Kong predominantly trade at steady levels with jumps during major market events. Japan shows the biggest swings around these periods, while Australia has remained stable with occasional dramatic shocks.
Open Interest Analysis
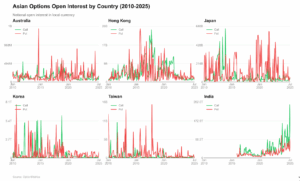
This chart displays notional open interest for calls (green) and puts (red) across six Asian markets from 2010-2025, using OptionMetrics data. Open interest represents the total value of outstanding contracts that haven’t been closed or exercised, showing us how much capital is committed to options positions and revealing each market’s preference for bullish versus bearish bets.
Put open interest (OI) generally dominates across most markets. Australia, Hong Kong, Japan, Korea, and Taiwan all show put OI consistently higher than call OI for most periods, reflecting the institutional use of index options for portfolio hedging. The put-call gaps tend to widen during periods that likely correspond to increased hedging activity.
India shows a different behavior. Call open interest runs higher than put OI for extended periods, especially from 2022 onwards. This is the opposite of what we see in other Asian markets and reflects the speculative, bullish nature of India’s individual investor base, a behavioral pattern that sets it apart from the more institutional-driven markets across the rest of the region.
Maturity Structure Evolution
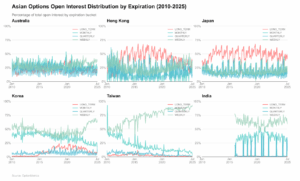
This chart tracks how Asian markets distribute their open interest across different expiration timeframes from 2010-2025, using OptionMetrics data, with each colored line showing what percentage of total positions fall into weekly (sage green), monthly (light blue), quarterly (darker blue), and long-term (pink) buckets. The data reveals whether each market leans toward short-term speculation or longer-term positioning strategies.
Mature markets show clear seasonal cycles. Australia, Hong Kong, and Japan all display regular fluctuations in their term structure, with longer-dated options expanding and contracting in fairly predictable patterns consistent with the expiration rolling cycle. Hong Kong and Japan show particularly strong long-term option activity compared to other markets in the region.
Korea demonstrates steady structural change. Long-dated options have grown consistently from almost nothing in the early years to regularly representing 10-15% of total OI. This shift happened gradually and appears to have stabilized at these higher levels. More recently, Korea has also seen an increase in short-term option activity.
Taiwan and India both favor short-term trading but show different trends. Both markets are heavily dominated by short-term options, with longer maturities making up a smaller portion of trades. Taiwan shows an increasing shift toward short-term dominance. India maintains a relatively stable short-term focus throughout most periods.
Asia’s divergent options trajectories demonstrate that market evolution is fundamentally shaped by local context, as regulatory choices, investor culture, and technology adoption create distinct paths that defy regional convergence expectations.
Analysis based on OptionMetrics IvyDB Asia data from 2010-2025. All figures in local currency unless otherwise specified.
The above analysis was written by the OptionMetrics Quantitative Finance Team.
For more insights on the options markets and volatility, visit the OptionMetrics blog.
There is an inherent risk involved with financial decisions. The information in this article is for informational purposes only and is not intended to provide financial advice. Views expressed are those of the author(s) and are not necessarily those of the company.